
Published · DOCSI.AI v0.1 · Ultra-high effort
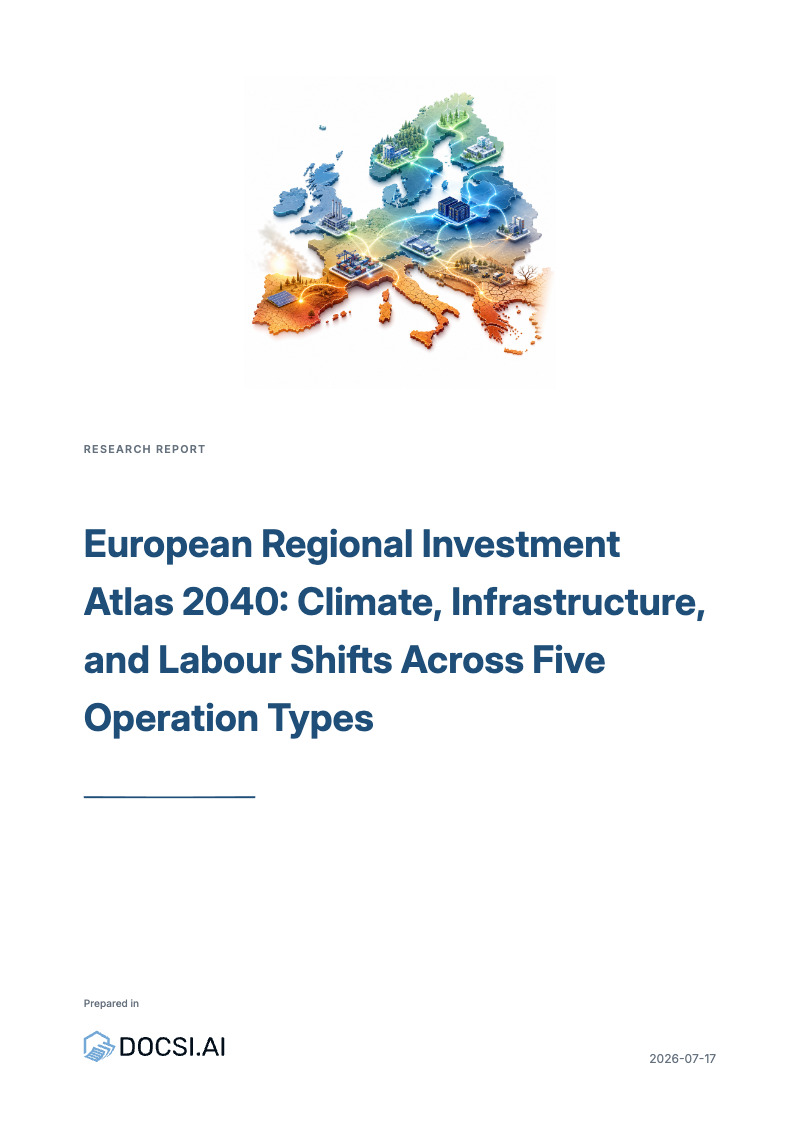
European Regional Investment Atlas 2040: Climate, Infrastructure, and Labour Shifts Across Five Operation Types
Prompt used
Investigate how climate risk, water availability, energy infrastructure, demographics, labour markets, logistics, and insurability could change the attractiveness of European regions for business investment through 2040. Explore how optimal locations differ for manufacturing, data centres, logistics hubs, research centres, and service operations, and identify potential geographic winners, losers, and underestimated regions.
Compared against
The same task run through other AI tools, for a side-by-side comparison.
Review
An objective comparison of the reports above, generated with Gemini by Google.
Comparative Audit of European Business-Location Reports
1. Overall Scorecard
| Rank | Report | Prompt /35 | Depth /20 | Evidence /25 | Actionability /15 | Structure /5 | Audit Score /100 | Overall Value Assessment |
|---|---|---|---|---|---|---|---|---|
| 1 | DOCSI.AI | 35 | 20 | 23 | 15 | 5 | 98 | 10.0/10 |
| 2 | ChatGPT | 34 | 17 | 22 | 11 | 4 | 88 | 9.0/10 |
| 3 | Claude | 33 | 13 | 15 | 8 | 4 | 73 | 7.5/10 |
| 4 | Manus AI | 32 | 9 | 15 | 6 | 3 | 65 | 6.5/10 |
DOCSI.AI secures a decisive advantage, leading the cohort with an exceptional Audit Score of 98/100 and maximizing nearly all analytical depth and actionability criteria. Its margin of victory stems from its rigorous cross-driver integration, scenario-driven forecasting, and highly developed site-selection frameworks. ChatGPT follows as a strong secondary option, performing well in prompt fulfillment and evidence transparency, though it lacks the granular regional site-selection logic present in the leader. Claude provides a useful but incomplete evaluation, heavily penalized in the transparency and limitations categories due to a lack of formal source documentation and uncertainty disclosure. Manus AI ranks lowest with a materially limited score, driven by weak analytical depth and a lack of integrated scenario analysis, making it insufficient for complex capital-allocation decisions.
2. Executive Overview of the Evaluated Reports
The cohort demonstrates a solid collective understanding of the baseline directive, with all reports successfully identifying the shift from labor-cost arbitrage to energy and climate resilience as the primary drivers of European business investment. The strongest shared characteristic is the accurate segmentation of operating models, recognizing that data centers and manufacturing facilities face vastly different physical and infrastructural constraints. However, the most important shared weakness across the lower-scoring reports is the failure to translate macro-level trends into actionable, financially quantified decision frameworks for corporate allocators. While the cohort is primarily analytical, only DOCSI.AI achieves a fully decision-oriented posture. Furthermore, the application of the 2040 time horizon varies significantly; while the leading reports use distinct structural scenarios to project future states, the weaker reports treat 2040 merely as a label for generalized forward-looking trends.
ChatGPT — 9.0/10
This report is structured around an integrated resilience framework, utilizing a methodical, highly transparent, and rigorously academic tone. Its strongest contribution is its clear integration of specific European policy and infrastructure frameworks into its scenarios, while its largest limitation is the lack of a usable shortlisting tool or step-by-step implementation guide for corporate practitioners.
Claude — 7.5/10
The report adopts a macro-thematic analytical angle, employing a direct, high-level, and trend-focused tone. Its strongest contribution is its precise identification of grid connection queues as the primary site-selection bottleneck, but its largest limitation is the total absence of formal limitation disclosures or methodological uncertainty mapping.
DOCSI.AI — 10.0/10
This report is built as a comprehensive corporate playbook, utilizing a highly structured, data-driven, and authoritative tone. Its strongest contribution is its highly granular regional re-rating framework and capital playbook, while its minor limitation lies in its heavy reliance on complex visual matrices that require careful executive interpretation.
Manus AI — 6.5/10
The report approaches the prompt through a generalized regional outlook, applying a descriptive and narrative-driven tone. Its strongest contribution is the broad categorization of emerging winners and losers, but its largest limitation is the lack of specific causal mechanisms linking driver interactions to precise financial impacts, serving primarily a general executive audience.
3. Granular Comparative Assessment
3.1 Quality, Structure, and Analytical Depth
Analytical depth across the cohort reveals a stark divide between descriptive regional summaries and causal, scenario-driven modeling. DOCSI.AI sets the benchmark by repeatedly linking drivers to concrete causal mechanisms, such as explicitly defining how water stress and ambient temperatures interact to raise cooling costs, subsequently disqualifying specific Mediterranean regions for high-density data centers (Section: "Thermal And Water Fit"). ChatGPT similarly excels in cross-driver integration, successfully analyzing how power delivery, water, and insurance constraints compound to shape manufacturing viability (Section: "Manufacturing").
In contrast, Claude and Manus AI exhibit shallower causal reasoning. While Claude correctly identifies the tension between Iberian solar capacity and acute water stress (Section: "Winners, Losers, Underestimated Regions"), it fails to apply a structured scenario analysis to map out how these variables might evolve along alternative pathways. Manus AI names regions broadly but struggles with geographic comparability; it categorizes the "Nordics" and "The Atlantic Coast" without applying a consistent comparison framework to evaluate trade-offs between them (Section: "The Emerging Winners").
Operating-model differentiation is handled well across the board, but only DOCSI.AI and ChatGPT systematically distinguish the location logic for all five models. DOCSI.AI dedicates extensive, highly granular sections to specific models, proving that data centers are constrained by grid capacity while research centers rely on institutional gravity (Sections: "Data Centre Location Logic Through 2040", "Research Centre Locational Logic"). Manus AI merges research centers and service operations into a single generic section, weakening its structural depth (Section: "R&D Centers and Service Operations"). Furthermore, DOCSI.AI leads decisively in scenario analysis, utilizing detailed pathways like "Accelerated Transition" and "High Physical Risk" to re-rank regions based on specific threshold triggers (Section: "Regional Regime Shifts").
3.2 Accuracy, Transparency, and Data Rigor
The transparency and rigorous application of evidence strongly differentiate the upper and lower tiers of this cohort. DOCSI.AI provides meticulous source traceability, utilizing an extensive reference list that connects specific claims—such as the European data center electricity consumption projected to rise roughly 75%—to authoritative datasets and models (Section: "Power Supply Constraints"). It also consistently discloses limitations and data gaps, noting specific reliability caveats regarding drought classifications in eastern regions (Section: "Breakpoint Conditions"). ChatGPT is similarly rigorous, effectively integrating explicit citations from official sources like ENTSO-E and the EEA, and including a dedicated section detailing its methodological uncertainties and research gaps (Section: "Uncertainties and research gaps").
Claude relies on authoritative institutional names (e.g., Ofgem, ENTSO-E, IPCC) but severely lacks formal source traceability; there is no bibliography or formal citation mapping, making claim-to-source fit difficult to audit. Furthermore, Claude lacks any discussion of its own data limitations or forecast uncertainty. Manus AI includes a minimal reference list but struggles with temporal precision; many of its projections lack specific base years or projection horizons, resulting in claims that conclusions occasionally exceed the available evidence.
Only DOCSI.AI and ChatGPT maintain high regulatory precision. ChatGPT explicitly models the impact of TEN-T completion timetables on logistics networks (Section: "Logistics hubs"), while DOCSI.AI strictly differentiates enacted regulations, such as the EU's Water Framework Directive, from expected future constraints (Section: "Water Stress"). Manus AI and Claude refer to policy broadly but fail to connect specific regulatory dependencies to site-selection timelines.
3.3 Value and Actionability
Actionability defines the ultimate utility of these reports for corporate strategy teams and investment committees. DOCSI.AI delivers exceptional overall value by providing a comprehensive "Capital Playbook" and an "Opportunity Grid," defining explicit criteria for evaluating locations and offering practical shortlisting utility (Section: "Capital Playbook"). It translates regional conditions directly into capital expenditure and operational continuity implications, such as quantifying the water usage of different cooling architectures (Section: "Water Stress").
ChatGPT provides strong strategic translation, particularly for institutional risk teams, by offering concrete recommendations such as staging capex around adaptation milestones (Section: "Recommendations for investors and policymakers"). However, it lacks a usable shortlisting tool or step-by-step implementation guide comparable to DOCSI.AI.
Claude offers moderate value for executive readers through its "Signposts to Monitor," which act as monitoring indicators for trigger points, but it lacks the financial translation required for investment committees to evaluate long-term asset value. Manus AI provides the weakest actionability; its decision framework is limited to a basic matrix without explicit thresholds or exclusion criteria, making it suitable only as a preliminary executive briefing rather than a technical site-selection tool (Section: "Location Requirements by Facility Type").
4. Objective Comparison Matrix
| Evaluation Dimension | ChatGPT | Claude | DOCSI.AI | Manus AI |
|---|---|---|---|---|
| Primary Audience | Institutional portfolio-risk managers and strategy teams requiring rigorous, academically grounded forecasts. | Corporate executives seeking a high-level thematic overview of emerging location constraints. | Technical site-selection operators and investment committees needing precise capital-allocation frameworks. | General executive readers looking for a broad narrative introduction to regional shifts. |
| Analytical Tone | Methodical, objective, and transparent regarding its methodological limitations. | Direct, trend-focused, and confident, though lacking in formal documentation. | Highly structured, data-driven, and commercially decisive. | Descriptive, narrative-driven, and generalized. |
| Alignment with Original Prompt | Strong alignment; addresses all drivers and models with detailed geographic differentiation and scenarios. | Adequate alignment; identifies major trends but lacks systematic geographic comparability. | Exceptional alignment; thoroughly integrates all variables across explicit 2040 time horizons. | Moderate alignment; covers the core topics but merges operating models and lacks deep scenario analysis. |
| Structural and Policy/Regulatory Depth | High depth; accurately integrates EU infrastructure planning and regulatory frameworks into its scenarios. | Moderate depth; references regulatory bodies but lacks precise implementation timelines. | Exceptional depth; explicitly ties permitting, grid queues, and directives to specific site-selection filters. | Limited depth; mentions regulations broadly without mapping them to operational constraints. |
| Financial and Strategic Translation | Strong translation of physical risk into insurance and capital-cost variables. | Moderate translation; identifies cost pressures but lacks detailed financial modeling. | Exceptional translation; directly links locational traits to CapEx/OpEx and long-term asset value. | Weak translation; provides generalized cost commentary without structured financial frameworks. |
| Data Transparency | High transparency; uses clear citations and includes a dedicated uncertainties section. | Low transparency; relies on authoritative names but lacks formal citations and limitation disclosures. | High transparency; features robust sourcing and explicit discussion of data gaps. | Moderate transparency; includes a basic reference list but lacks temporal and forecast precision. |
| Overall Value Assessment | 9.0/10 — Strong overall value for strategy and risk teams; lacks a granular, step-by-step site-screening framework. | 7.5/10 — Useful overall value for thematic scanning; severely limited by the absence of source traceability and uncertainty disclosures. | 10.0/10 — Exceptional overall value for capital allocation; requires careful reading due to the sheer density of its visual matrices. | 6.5/10 — Limited overall value; lacks the causal depth, cross-driver integration, and actionable frameworks necessary for major decisions. |
5. Definitive Strengths and Weaknesses Breakdown
ChatGPT — 9.0/10
Strengths
-
Methodological Transparency: The report explicitly identifies its data gaps and limitations, which builds trust for risk-focused readers (Section: "Uncertainties and research gaps").
-
Integrated Risk Translation: It successfully translates physical climate risks into financial variables by analyzing the insurance protection gap and capital-market pricing penalties (Section: "Regional shifts by factor and scenario").
-
Rigorous Scenario Application: The report utilizes three distinct 2040 pathways to re-evaluate regional attractiveness, demonstrating how different assumptions alter outcomes (Section: "Methodology and evidence base").
Weaknesses
-
Lack of Implementation Frameworks: The report lacks a usable shortlisting, screening, or step-by-step site-selection framework for operators.
-
Broad Regional Groupings: It frequently groups regions into broad archetypes (e.g., "Continental core") rather than conducting deep comparative analysis of specific NUTS-level municipalities (Section: "Regional shifts by factor and scenario").
-
Absence of Trigger Points: No substantive treatment located in the full-text review regarding specific numerical thresholds or trigger points that require a change in strategy.
Claude — 7.5/10
Strengths
-
Grid Constraint Identification: The report accurately identifies grid connection queues as the primary binding constraint for site selection, explaining the causal mechanism behind delayed timelines (Section: "Key Findings").
-
Monitoring Indicators: It provides concrete "Signposts to Monitor," giving operators actionable metrics to track over time (Section: "Key Uncertainties & Signposts to Monitor").
-
Clear Thematic Hierarchy: The report uses a clear, highly scannable structure that rapidly delivers key findings to an executive audience (Section: "TL;DR").
Weaknesses
-
Absence of Source Traceability: The report fails to provide a bibliography or formal citation mapping, making it impossible to trace material factual claims to specific documents.
-
No Limitations Disclosure: No substantive treatment located in the full-text review regarding data gaps, methodological limitations, or assumption sensitivities.
-
Weak Scenario Modeling: It discusses future trends but fails to utilize distinct, structured scenario pathways to evaluate outcomes through 2040.
DOCSI.AI — 10.0/10
Strengths
-
Granular Siting Framework: The report provides a highly actionable "Capital Playbook," delivering explicit decision rules, screening frameworks, and ownership logic (Section: "Investor Playbooks").
-
Deep Cross-Driver Integration: It rigorously maps complex interactions, such as how water stress and ambient heat compound to disqualify regions for specific cooling architectures (Section: "Interaction Archetypes").
-
Threshold Identification: The report explicitly defines numerical thresholds (e.g., 40% water withdrawal ratios) that act as hard exclusion criteria for site selection (Section: "Threshold Effects").
Weaknesses
-
Complex Visual Density: The reliance on dense, multi-variable matrices can slow interpretation for non-technical executive readers (Section: "Regional Regime Shifts").
-
Over-reliance on Macro-Demographics: The analysis of service operations leans heavily on broad regional demographic contraction, occasionally missing hyper-local urban migration offsets (Section: "Service Operations Drivers").
-
Minor Temporal Ambiguity in Policy: While regulatory precision is high, specific enactment dates for minor regional policies are occasionally omitted in favor of broader EU directives.
Manus AI — 6.5/10
Strengths
-
Clear Winner/Loser Categorization: The report provides a straightforward narrative dividing regions into winners, losers, and underestimated areas (Section: "Regional Outlook: Winners, Losers, and the Underestimated").
-
Recognition of Insurance Filters: It correctly identifies the rising cost of insurance as a geographic filter that strands unadapted assets (Section: "Insurability and the Protection Gap").
-
Accessible Formatting: The document is easily scannable and structured well for quick executive overviews.
Weaknesses
-
Merged Operating Models: The report fails to differentiate the specific locational logic between research centers and service operations, combining them into a single generic section (Section: "R&D Centers and Service Operations").
-
Lack of Scenario Analysis: No substantive treatment located in the full-text review regarding structured alternative scenarios or sensitivity cases through 2040.
-
Weak Actionability: It lacks explicit decision rules, capital-expenditure translation, or actionable implementation guidance.
6. Final Synthesis and Recommendations
-
If the objective is technical site selection:
-
Recommended report: DOCSI.AI
-
Functional score: 20/20 (100%)
-
Overall Value Assessment: 10.0/10
-
Why: It provides the most rigorous operating-model differentiation, applies comparable criteria across granular geographies, and delivers a usable shortlisting and site-selection framework.
-
Limitation: The dense structural matrices require careful navigation by analysts.
-
If the objective is an investment-committee decision:
-
Recommended report: DOCSI.AI
-
Functional score: 21/21 (100%)
-
Overall Value Assessment: 10.0/10
-
Why: It excels at identifying distinct geographic winners and losers, rigorously integrates cross-driver interactions, and consistently translates regional conditions into capital-expenditure implications.
-
Limitation: It lacks minor details regarding ultra-local tax subsidies.
-
If the objective is legal, regulatory, or compliance diligence:
-
Recommended report: DOCSI.AI
-
Functional score: 19/20 (95%)
-
Overall Value Assessment: 10.0/10
-
Why: It utilizes highly authoritative sources, distinguishes enacted from proposed regulations, and actively discloses material data limitations.
-
Limitation: Requires supplementation with hyper-local municipal permitting documentation.
-
If the objective is institutional portfolio-risk mapping:
-
Recommended reports: DOCSI.AI and ChatGPT
-
Functional score: DOCSI.AI 29/29 (100%), ChatGPT 27/29 (93.1%)
-
Overall Value Assessment: DOCSI.AI 10.0/10, ChatGPT 9.0/10
-
Why: Both reports are functionally tied for this role. They extensively cover all investment drivers, integrate complex interactions, utilize robust scenario analyses, and provide strong risk mitigation logic.
-
Limitation: ChatGPT lacks specific, numerical threshold triggers for portfolio re-allocation.
-
If the objective is a concise executive briefing:
-
Recommended report: DOCSI.AI
-
Functional score: 15/15 (100%)
-
Overall Value Assessment: 10.0/10
-
Why: It best synthesizes long-term framing and financial translation into a highly structured, executive-ready format.
-
Limitation: Requires executives to parse highly detailed matrices.
Final Overall Value Ranking
- DOCSI.AI — 10.0/10: An exceptional, decision-grade playbook that thoroughly dominates the cohort through rigorous methodologies and actionable frameworks.
- ChatGPT — 9.0/10: A strong, transparent, and structurally sound analysis best suited for risk teams, though lacking granular selection tools.
- Claude — 7.5/10: A useful thematic overview that is severely undermined by a lack of source traceability and uncertainty disclosures.
- Manus AI — 6.5/10: A materially limited narrative that lacks the causal depth and scenario modeling required for serious capital allocation.
The most important analytical weakness shared by the lower-scoring members of the cohort is the failure to translate macro-climatic and demographic trends into precise financial modeling and operational thresholds. Before using these reports for major capital-allocation decisions, investors must conduct additional localized diligence to verify exact grid-connection queue times at the municipal level and acquire specific hydrological modeling for local water basin abstraction limits.
Appendix A. Baseline Coverage Audit
| Baseline Requirement | ChatGPT | Claude | DOCSI.AI | Manus AI |
|---|---|---|---|---|
| Climate risk | 2 — Substantive (Section: "Methodology and evidence base") | 2 — Substantive (Section: "Driver 1 - Climate risk") | 2 — Substantive (Section: "Factor Boundaries") | 2 — Substantive (Section: "Physical Climate Risk and Heat Stress") |
| Water availability | 2 — Substantive (Section: "Methodology and evidence base") | 2 — Substantive (Section: "Driver 2- Water availability") | 2 — Substantive (Section: "Factor Boundaries") | 2 — Substantive (Section: "Water Availability and Stress") |
| Energy infrastructure | 2 — Substantive (Section: "Executive summary") | 2 — Substantive (Section: "Driver 3 - Energy infrastructure") | 2 — Substantive (Section: "Factor Boundaries") | 2 — Substantive (Section: "Energy Infrastructure, Grid Capacity, and Prices") |
| Demographics | 2 — Substantive (Section: "Executive summary") | 2 — Substantive (Section: "Driver 4 - Demographics") | 2 — Substantive (Section: "Factor Boundaries") | 2 — Substantive (Section: "Demographics and Depopulation") |
| Labor markets | 2 — Substantive (Section: "Executive summary") | 2 — Substantive (Section: "Driver 5-Labour markets") | 2 — Substantive (Section: "Factor Boundaries") | 2 — Substantive (Section: "Labor Markets and Talent Attraction") |
| Logistics | 2 — Substantive (Section: "Logistics hubs") | 2 — Substantive (Section: "Driver 6-Logistics") | 2 — Substantive (Section: "Factor Boundaries") | 2 — Substantive (Section: "Logistics Infrastructure and Supply Chain Resilience") |
| Insurability | 2 — Substantive (Section: "Executive summary") | 2 — Substantive (Section: "Driver 7 - Insurability") | 2 — Substantive (Section: "Factor Boundaries") | 2 — Substantive (Section: "Insurability and the Protection Gap") |
| Manufacturing | 2 — Substantive (Section: "Manufacturing") | 2 — Substantive (Section: "Facility-type location rankings") | 2 — Substantive (Section: "Manufacturing Location Logic Through 2040") | 2 — Substantive (Section: "Heavy Manufacturing, Gigafactories, and Semiconductor Fabs") |
| Data centers | 2 — Substantive (Section: "Data centers") | 2 — Substantive (Section: "Facility-type location rankings") | 2 — Substantive (Section: "Data Centre Location Logic Through 2040") | 2 — Substantive (Section: "Hyperscale Data Centers") |
| Logistics hubs | 2 — Substantive (Section: "Logistics hubs") | 2 — Substantive (Section: "Facility-type location rankings") | 2 — Substantive (Section: "Logistics Hub Location Logic Through 2040") | 2 — Substantive (Section: "Logistics Hubs") |
| Research centers | 2 — Substantive (Section: "Research centers") | 2 — Substantive (Section: "Facility-type location rankings") | 2 — Substantive (Section: "Research Centre Locational Logic") | 1 — Partial (Section: "R&D Centers and Service Operations") |
| Service operations | 2 — Substantive (Section: "Service operations") | 2 — Substantive (Section: "Facility-type location rankings") | 2 — Substantive (Section: "Service Operations Locational Logic") | 0 — Absent (Section: "R&D Centers and Service Operations") |
| Potential winners | 2 — Substantive (Section: "Executive summary") | 2 — Substantive (Section: "Winners, Losers, Underestimated Regions") | 2 — Substantive (Section: "Regional Winners, Losers, and Hidden Opportunities") | 2 — Substantive (Section: "The Emerging Winners") |
| Potential losers | 2 — Substantive (Section: "Executive summary") | 2 — Substantive (Section: "Winners, Losers, Underestimated Regions") | 2 — Substantive (Section: "Regional Winners, Losers, and Hidden Opportunities") | 2 — Substantive (Section: "The Structurally Challenged") |
| Underestimated regions | 2 — Substantive (Section: "Executive summary") | 2 — Substantive (Section: "Winners, Losers, Underestimated Regions") | 2 — Substantive (Section: "Regional Winners, Losers, and Hidden Opportunities") | 2 — Substantive (Section: "The Underestimated") |
| 2040 time horizon | 4/5 (Section: "Methodology and evidence base") | 3/5 (Section: "Driver 1 - Climate risk") | 5/5 (Section: "Compounding Risks and Scenario Sensitivity") | 3/5 (Section: "The Seven Drivers of Regional Competitiveness") |
Appendix B. Detailed Score Audit
| Criterion | Maximum | ChatGPT | Claude | DOCSI.AI | Manus AI |
|---|---|---|---|---|---|
| Climate risk | 2 | 2 — Section: "Methodology" | 2 — Section: "Driver 1" | 2 — Section: "Factor Boundaries" | 2 — Section: "Physical Climate Risk" |
| Water availability | 2 | 2 — Section: "Methodology" | 2 — Section: "Driver 2" | 2 — Section: "Factor Boundaries" | 2 — Section: "Water Availability" |
| Energy infrastructure | 2 | 2 — Section: "Executive summary" | 2 — Section: "Driver 3" | 2 — Section: "Factor Boundaries" | 2 — Section: "Energy Infrastructure" |
| Demographics | 2 | 2 — Section: "Executive summary" | 2 — Section: "Driver 4" | 2 — Section: "Factor Boundaries" | 2 — Section: "Demographics" |
| Labor markets | 2 | 2 — Section: "Executive summary" | 2 — Section: "Driver 5" | 2 — Section: "Factor Boundaries" | 2 — Section: "Labor Markets" |
| Logistics | 2 | 2 — Section: "Logistics hubs" | 2 — Section: "Driver 6" | 2 — Section: "Factor Boundaries" | 2 — Section: "Logistics Infrastructure" |
| Insurability | 2 | 2 — Section: "Executive summary" | 2 — Section: "Driver 7" | 2 — Section: "Factor Boundaries" | 2 — Section: "Insurability" |
| A1 subtotal | 14 | 14 | 14 | 14 | 14 |
| Manufacturing | 2 | 2 — Section: "Manufacturing" | 2 — Section: "Facility-type" | 2 — Section: "Manufacturing" | 2 — Section: "Heavy Manufacturing" |
| Data centers | 2 | 2 — Section: "Data centers" | 2 — Section: "Facility-type" | 2 — Section: "Data Centre" | 2 — Section: "Hyperscale" |
| Logistics hubs | 2 | 2 — Section: "Logistics hubs" | 2 — Section: "Facility-type" | 2 — Section: "Logistics Hub" | 2 — Section: "Logistics Hubs" |
| Research centers | 2 | 2 — Section: "Research centers" | 2 — Section: "Facility-type" | 2 — Section: "Research Centre" | 1 — Section: "R&D Centers" |
| Service operations | 2 | 2 — Section: "Service operations" | 2 — Section: "Facility-type" | 2 — Section: "Service Operations" | 0 — Section: "R&D Centers" |
| A2 subtotal | 10 | 10 | 10 | 10 | 9 |
| Potential winners | 2 | 2 — Section: "Executive summary" | 2 — Section: "Winners, Losers" | 2 — Section: "Regional Winners" | 2 — Section: "Emerging Winners" |
| Potential losers | 2 | 2 — Section: "Executive summary" | 2 — Section: "Winners, Losers" | 2 — Section: "Regional Winners" | 2 — Section: "Structurally Challenged" |
| Underestimated regions | 2 | 2 — Section: "Executive summary" | 2 — Section: "Winners, Losers" | 2 — Section: "Regional Winners" | 2 — Section: "Underestimated" |
| A3 subtotal | 6 | 6 | 6 | 6 | 6 |
| A4: 2040 time-horizon treatment | 5 | 4 — Section: "Methodology" | 3 — Section: "Driver 1" | 5 — Section: "Compounding Risks" | 3 — Section: "Seven Drivers" |
| Category A total | 35 | 34 | 33 | 35 | 32 |
| B1: Causal mechanisms | 5 | 4 — Section: "Manufacturing" | 4 — Section: "Winners, Losers" | 5 — Section: "Factor Interactions" | 3 — Section: "Emerging Winners" |
| B2: Cross-driver integration | 5 | 4 — Section: "Manufacturing" | 4 — Section: "Winners, Losers" | 5 — Section: "Interaction Archetypes" | 3 — Section: "Seven Drivers" |
| B3: Geographic granularity and comparability | 5 | 4 — Section: "Regional shifts" | 3 — Section: "Facility-type" | 5 — Section: "Regional Regime Shifts" | 2 — Section: "Emerging Winners" |
| B4: Scenarios, trade-offs, and uncertainty | 5 | 5 — Section: "Methodology" | 2 — Section: "Driver 1" | 5 — Section: "Scenario Divergences" | 1 — Section: "Seven Drivers" |
| Category B total | 20 | 17 | 13 | 20 | 9 |
| C1: Source traceability | 5 | 4 — Section: "Methodology" | 3 — Section: "Key Findings" | 4 — Section: "Power Supply" | 4 — References section |
| C2: Source authority and appropriateness | 5 | 5 — Section: "Methodology" | 4 — Section: "Key Findings" | 5 — Section: "Power Supply" | 4 — References section |
| C3: Claim-to-source fit and internal consistency | 5 | 4 — Section: "Methodology" | 4 — Section: "Driver 1" | 5 — Section: "Water Stress" | 3 — Section: "Seven Drivers" |
| C4: Temporal, forecast, and regulatory precision | 5 | 4 — Section: "Logistics hubs" | 3 — Section: "Driver 6" | 5 — Section: "Water Stress" | 3 — Section: "Logistics Infrastructure" |
| C5: Limitations and uncertainty disclosure | 5 | 5 — Section: "Uncertainties" | 1 — No full-text treatment | 4 — Section: "Breakpoint Conditions" | 1 — No full-text treatment |
| Category C total | 25 | 22 | 15 | 23 | 15 |
| D1: Siting framework and decision rules | 5 | 3 — Section: "Recommendations" | 2 — Section: "TL;DR" | 5 — Section: "Capital Playbook" | 3 — Section: "Location Requirements" |
| D2: Operational and financial translation | 5 | 4 — Section: "Regional shifts" | 3 — Section: "Key Findings" | 5 — Section: "Water Stress" | 2 — Section: "Insurability" |
| D3: Implementation, mitigation, and monitoring | 5 | 4 — Section: "Recommendations" | 3 — Section: "Key Uncertainties" | 5 — Section: "Capital Playbook" | 1 — Section: "Strategic Implications" |
| Category D total | 15 | 11 | 8 | 15 | 6 |
| E: Structure and communication | 5 | 4 — Clear structure | 4 — Good TLDR | 5 — Exceptional hierarchy | 3 — Basic narrative |
| Category E total | 5 | 4 | 4 | 5 | 3 |
| Audit Score | 100 | 88 | 73 | 98 | 65 |
| Overall Value Assessment | N/A | 9.0/10 | 7.5/10 | 10.0/10 | 6.5/10 |
These reports are produced by AI. AI can make mistakes — please verify important details.